The sample program is:
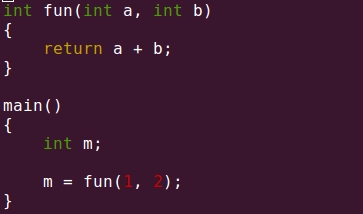 |
The procedure is:
1. The current value of r4 (used as frame pointer in MSP430 family) is pushed
into the stack. The stack pointer (r1) automatically gets decremented by 2.
2. r1 gets decremented again by an offset, thus allocating a stack frame. The
offset by which r1 gets decremented depends on the number of local variables
in the called function.
Here, r1 gets decremented by 4, since there are two local variables for fun(), a
and b.
3. The current value of the stack pointer r1 is copied into r4 (the register r4 thus
indicates the frame pointer for the currently executing function).
All further manipulations of the local variables will be with reference to the
frame pointer r4.
4. After the body of the called function is executed, the same offset as above is
added back to the stack pointer r1, thus deallocating the stack frame.
5. The current value of r1 is popped into r4, thus retrieving the previous stack
frame. The stack pointer r1 gets auto-incremented by 2.

The assembler directives __FrameSize and __FrameOffset gives the size and offset of the frame allocated for the function fun().
Pointers
The sample program is:

On generating the corresponding assembly code:

The code can be traced as follows:
1. The number 10 is stored in the memory address which is at an offset of 2 bytes
from the location pointed to by the frame pointer r4.
2. The memory address of 10, i.e. the value of (r4 + 2), is stored in the memory
location pointed to by r4.
3. The data in the location pointed to by the register r4 is safely interpreted as
another memory address, and the number 20 is stored in this particular address.
And you thought "pointers" were magic !!!
Variables
The most simple case would be:

But on still expecting the prologue and epilogue:

The number 100 is stored in a memory location addressed with reference to the frame pointer r4.
The variable i is local to the function main() so no extra work.
Static Variables
The demonstration will be like:

Wondering how the assembly code would look like:

The static integer 200 is stored in a similar way as above, but to a different address. Also this address (label i.1194) is located in the .data section, instead of the usual .text section.
All global and static variables (which have their lifetime as long as the whole program), are stored in the .data section.
Pointers to Functions
Considering the sample code:

A simple pointer to a function accepting void and returning void is created. It is assigned the memory address of the function fun(). Then this pointer to a function f is called.
Awaiting the assembly code:

The pointer f is local to the function main(). Hence, a stack frame of size 2 is allocated, as expected. The value of f, i.e. the memory address of function fun(), is stored in the location pointed to by the frame pointer r4. This address is then simply passed to the call instruction.


